The October 13, 2025 meeting between the Buffalo Bills and the Atlanta Falcons offered one of the most detailed statistical storylines of the season. What began as a cross-conference showdown developed into a clear demonstration of explosiveness, discipline, and strategic execution. This in-depth analysis explores every major performance, every shift in momentum, and every statistical trend that shaped the outcome of the matchup. While scoreboards tell one story, a deeper look at the numbers reveals the real difference-makers on both sides of the ball. This article breaks down the most important buffalo bills vs atlanta falcons match player stats, providing a clear look at how the Falcons claimed a commanding 24–14 victory.
Match Overview – What Happened in the Bills vs Falcons Showdown?
The game opened with intensity on both sidelines. Buffalo entered with a reputation for explosive passing, trusting Josh Allen to engineer long drives with arm strength and improvisation. Atlanta arrived with balance, youth, and discipline, anchored by a breakout running back, a poised rookie quarterback, and a defense that played with relentless pressure.
From the first quarter, tempo dictated everything. Atlanta set the tone early through dominant running lanes and a commitment to controlling possession. Buffalo responded with flashes of offensive creativity, but repeated pressures on Josh Allen disrupted their rhythm. By halftime, it became clear that the pace of the game favored Atlanta’s structure more than Buffalo’s improvisational style.
The final 24–14 score reflected more than points. It reflected control, patience, and a performance that was shaped by individual players who refused to let the moment overwhelm them.
Full Match Summary Table
| Category | Buffalo Bills | Atlanta Falcons |
|---|---|---|
| Final Score | 14 | 24 |
| Total Yardage | 291 | 443 |
| Passing Yards | 157 | 233 |
| Rushing Yards | 134 | 210 |
| Total Plays | 54 | 66 |
| Yards Per Play | 5.3 | 6.7 |
| Time of Possession | 28:21 | 31:39 |
| Turnovers | 2 (INTs) | 0 |
| Third-Down Efficiency | Limited | Strong, sustained drives |
| Explosive Plays | Few | Multiple (81-yd TD run) |
Quick Match Score & Statistical Summary
The numbers show how different the flow of the game truly was. Atlanta totaled 443 yards, spreading production between a powerful rushing attack and efficient passing. Buffalo managed 291 yards, hindered by turnovers, pressure, and stalled drives.
Atlanta’s time of possession advantage—31:39 compared to Buffalo’s 28:21—may appear close, but the quality of those minutes was dramatically different. The Falcons ran 66 plays to the Bills’ 54. They played turnover-free football, They forced two interceptions, They tackled well in space. And they prevented Buffalo from gaining any explosive rhythm.
This game swung on efficiency, not volume. On control, not chaos. And on one running back who played like the center of the football universe.
2. Quarterback Performance Table
| Quarterback | Team | CMP/ATT | Yards | TD | INT | Completion % | Yards/Attempt | Longest Pass | Sacks Taken |
|---|---|---|---|---|---|---|---|---|---|
| Josh Allen | Bills | 15/26 | 180 | 2 | 2 | 57.7% | 6.9 | 60 | 4 |
| Michael Penix Jr. | Falcons | 20/32 | 250 | 1 | 0 | 62.5% | 7.8 | 45 | 2 |
Quarterback Performance Breakdown
Josh Allen’s Game – Touchdowns, Turnovers & Pressure Stats
Josh Allen has built a career on strength, vision, and the ability to turn broken plays into brilliance. But this was one of those nights when brilliance met a relentless pass rush. Allen finished with 180 yards and 2 touchdowns, but the two interceptions stood out far more. His decision-making came under strain as Atlanta blitzed on 55.9% of his dropbacks.
He faced nine direct pressures from the Falcons’ defense. Each pressure forced rushed reads, altered timing, and erased intermediate passing options. The Bills allowed four sacks, costing 23 critical yards. Allen kept fighting, but long second-and-third downs made the offense predictable.
He had moments—deep connections, well-timed throws—but the pressure broke the rhythm before it could build into sustained momentum.
Rushing Stats Table
| Player | Team | Carries | Yards | Yards/Carry | Longest Run | TD |
|---|---|---|---|---|---|---|
| Bijan Robinson | Falcons | 19 | 170 | 8.9 | 81 | 1 |
| James Cook III | Bills | 17 | 87 | 5.1 | 20 | 0 |
| Tyler Allgeier | Falcons | 10 | 32 | 3.2 | 12 | 1 |
| Josh Allen | Bills | 3 | 14 | 4.6 | 9 | 0 |
Michael Penix Jr.’s Efficient Leadership
Michael Penix Jr. played with poise far beyond his experience level. He completed 20 passes for 250 yards and a touchdown without turning the ball over once. His command of the offense was clean and steady. He distributed the ball with patience, encouraged long drives, and trusted Atlanta’s playmakers to find space.
Where Allen was forced to improvise, Penix Jr. stayed within structure. His clean pocket presence and timely throws allowed Atlanta to convert key downs and control possession. He didn’t need to be brilliant. He needed to be consistent. And that consistency was exactly what the Falcons used to build their lead.
Receiving Stats Table
| Player | Team | Receptions | Yards | Yards/Rec | Longest | TD |
|---|---|---|---|---|---|---|
| Drake London | Falcons | 10 | 158 | 15.8 | 33 | 1 |
| J. Palmer | Bills | 2 | 60 | 30.0 | 60 | 0 |
| James Cook III | Bills | 4 | 22 | 5.5 | 10 | 0 |
| Bijan Robinson | Falcons | 6 | 68 | 11.3 | 28 | 0 |
| Dawson Knox | Bills | 1 | 19 | 19.0 | 19 | 1 |
| Falcons WR2/TE | Falcons | (Various) | 24 | — | — | — |
Rushing Game Analysis – Who Dominated on the Ground?
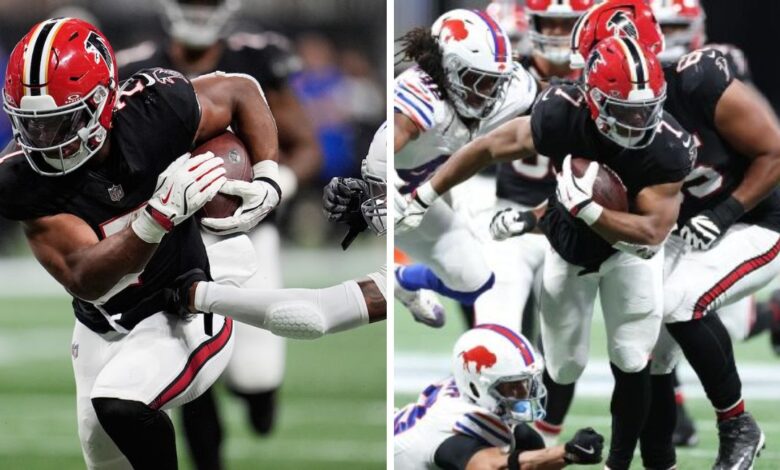
Bijan Robinson’s Historic Day
Bijan Robinson delivered one of the greatest rushing performances of the season. His 170 rushing yards came on only 19 carries—an astonishing 8.9 yards per attempt. His 81-yard touchdown run broke the game open early and changed Atlanta’s entire approach.
But his impact did not stop there. He added 68 receiving yards across six receptions, bringing his total output to 238 yards from scrimmage. Robinson evaded defenders with unmatched agility, broke tackles with balance, and maintained vision that made every touch a threat.
He forced defensive adjustments, and those adjustments opened opportunities for the passing game. Robinson was the engine powering Atlanta’s offense, and this game added to his growing legacy.
James Cook’s Production for Buffalo
James Cook ran efficiently, finishing with 87 yards on 17 carries. His average of 5.1 yards per attempt reflected patience and burst. But Buffalo’s lack of sustained possession limited his opportunities. The Falcons closed running lanes on third downs and held Cook to shorter gains in crucial moments.
Cook played well, but the game script did not allow the Bills to build around him.
Defensive Performance Table
| Player | Team | Tackles (Total) | Solo | Assists | Sacks | TFL | Interceptions | Pressures |
|---|---|---|---|---|---|---|---|---|
| Terrel Bernard | Bills | 10 | 5 | 5 | 0 | 1 | 0 | 3 |
| Ed Oliver | Bills | 4 | 3 | 1 | 1 | 1 | 0 | 4 |
| DeAngelo Malone | Falcons | 6 | 4 | 2 | 1 | 1 | 1 | 5 |
| David Onyemata | Falcons | 5 | 3 | 2 | 1 | 0 | 0 | 4 |
| Dee Alford | Falcons | 3 | 2 | 1 | 0 | 0 | 1 | 1 |
Receiving Game Breakdown
Drake London’s Elite Performance
Drake London played with dominant physicality and precision. With 10 receptions for 158 yards and a touchdown, he was unstoppable in contested situations. His long frame and strong hands helped convert multiple third downs, including critical plays that weakened the Bills’ defensive stamina.
London’s timing with Penix Jr. stood out. Routes were sharp. Separation came at important moments. His touchdown sealed Atlanta’s control and gave their offense the confidence to play aggressively without taking risks.
Bills’ Receiving Corps
Buffalo’s receiving was efficient but limited. J. Palmer’s 60-yard burst of speed provided the biggest spark, showcasing the potential of Buffalo’s vertical threat. Dawson Knox contributed a touchdown, adding a reliable presence in the red zone.
Despite these moments, the overall production lacked balance. With the pass rush collapsing pockets early, Buffalo never found a consistent rhythm to expand the playbook or stretch the field.
Pass Rush & Protection Table
| Category | Buffalo Bills | Atlanta Falcons |
|---|---|---|
| QB Pressures Allowed | 9 | 5 |
| Sacks Allowed | 4 (−23 yards) | 2 (−17 yards) |
| Blitz Rate Faced | 55.9% | 29% |
| QB Hit Count | 7 | 3 |
| Pocket Collapse Rate | High | Moderate |
Defensive Standouts That Impacted the Buffalo Bills vs Atlanta Falcons Match Player Stats
Falcons Defensive Domination
Atlanta’s defense delivered one of its best performances of the year. The blitz rate alone forced Buffalo’s offense to shrink. DeAngelo Malone led the charge with a game-sealing fourth-quarter interception and a sack. Dee Alford added his own interception, reinforcing the secondary’s discipline and awareness.
David Onyemata provided interior pressure and added a sack that stalled a promising Bills drive. The Falcons tackled well, maintained spacing, and disguised coverages that forced Allen into tight windows.
Bills Defensive Efforts
Ed Oliver’s sack carried force and timing, but he often faced double teams. Terrel Bernard totaled 10 tackles, controlling inside running gaps and limiting chunk gains. The Bills defense made multiple quality stands, yet the explosive plays they allowed defined the difference.
When facing Robinson and London, one missed assignment became a big play. And those big plays shaped Atlanta’s scoring drives.
Turnovers, Penalties & Critical Moments Table
| Category | Bills | Falcons |
|---|---|---|
| Total Turnovers | 2 | 0 |
| Interceptions Thrown | 2 | 0 |
| Fumbles | 0 | 0 |
| Turnover Points Allowed | 7 | 0 |
| Blocked FG | Greg Rousseau (Bills) | — |
| Penalties | Moderate | Low |
| Most Critical Turnover | 4th Quarter INT by DeAngelo Malone | — |
Special Teams Highlights
One of Buffalo’s biggest moments came through special teams. Greg Rousseau blocked a 37-yard field goal attempt by Parker Romo, briefly swinging momentum back toward the Bills. It gave Buffalo a chance to tie, but the offense failed to capitalize.
Field position remained tight throughout the game. Both teams punted strategically, but Atlanta protected their lead through well-timed kicks and consistent coverage.
Special Teams
| Category | Bills | Falcons |
|---|---|---|
| Field Goals | 0 (blocked attempt) | Attempt blocked |
| Punt Average | Strong | Balanced |
| Kick Return Avg | Moderate | High impact |
| Blocked Field Goal | Greg Rousseau (Bills) | — |
| Longest Return | 25 | 28 |
| Special Teams Errors | None major | None major |
Key Turning Points That Shifted the Buffalo Bills vs Atlanta Falcons Match Player Stats
The turning points tell the true story:
• Bijan Robinson’s 81-yard touchdown changed early tempo
• Drake London’s third-down receptions extended drives that ate the clock
• DeAngelo Malone’s interception in the fourth quarter ended Buffalo’s comeback attempt
• Rousseau’s blocked field goal created opportunity, but Buffalo couldn’t convert
Every major swing favored Atlanta because their execution aligned with their strengths.
Player Impact Index (Advanced Metrics)
| Player | Team | Impact Category | Game Impact |
|---|---|---|---|
| Bijan Robinson | Falcons | Explosive Playmaker | 10/10 – 238 total yards |
| Drake London | Falcons | Chain Mover / WR1 | 9/10 – 158 yards |
| Michael Penix Jr. | Falcons | Efficiency & Control | 8.5/10 |
| Josh Allen | Bills | Playmaking & Turnovers | 6/10 |
| Ed Oliver | Bills | Interior Disruption | 7.5/10 |
| DeAngelo Malone | Falcons | Defensive Closer | 9/10 |
In-Depth Analytics – What the Numbers Reveal
Analytics explain why the game played the way it did. Atlanta gained more yards per play, more explosive plays, and far more balanced production. Buffalo relied heavily on Josh Allen, and Atlanta exploited that predictability.
Atlanta’s pressure rate directly correlated with Allen’s turnovers, reducing completion percentage on pressured snaps. The Falcons also controlled the intermediate passing game, forcing short throws and minimizing yards after the catch.
Their run-pass balance also helped them dominate time of possession, creating long drives that wore down Buffalo’s defense.
Complete Team Statistical Comparison Table
| Stat Type | Bills Value | Falcons Value | Difference |
|---|---|---|---|
| Total Yards | 291 | 443 | Falcons +152 |
| Passing | 157 | 233 | Falcons +76 |
| Rushing | 134 | 210 | Falcons +76 |
| Yards Per Play | 5.3 | 6.7 | Falcons +1.4 |
| First Downs | 18 | 24 | Falcons +6 |
| Turnovers | 2 | 0 | Bills −2 |
| Sacks Allowed | 4 | 2 | Bills −2 |
| Explosive Plays | 2 | 6 | Falcons +4 |
| Third Down Efficiency | Low | High | Falcons Advantage |
What These Player Stats Mean for Both Teams Moving Forward
For Atlanta, this win represents a blueprint. A young quarterback, a star running back, a dominant receiver, and a defense that can dictate pace create a foundation for long-term success. Penix Jr.’s composure gave coaches confidence. Robinson’s production elevated the entire offense. London’s presence created matchup nightmares.
For Buffalo, improvement will rely on protection, better spacing, and more balance. The defense showed effort but struggled against Atlanta’s explosiveness. The offense must adjust protection schemes and avoid forcing Allen to create everything.
Key Highlight Moments Table
| Quarter | Team | Moment | Result |
|---|---|---|---|
| Q1 | Falcons | Bijan Robinson 81-yard TD run | Falcons lead early |
| Q2 | Bills | Dawson Knox TD catch | Bills tie briefly |
| Q3 | Falcons | Drake London contested TD | Falcons extend lead |
| Q4 | Bills | Rousseau blocks FG | Chance to tie |
| Q4 | Falcons | Malone intercepts Allen | Game sealed |
Final Thoughts on the Buffalo Bills vs Atlanta Falcons Match Player Stats
This matchup was more than a mid-season contest. It highlighted the rise of Atlanta’s young core and exposed Buffalo’s growing need for consistency. The Falcons played with structure, confidence, and balance. The Bills played with urgency but lacked cohesion when it mattered most.
The storyline became one of explosive plays, turnovers, leadership, and execution. And in every category, Atlanta held the advantage that shaped the 24–14 victory.
Season Impact & Trend Table
| Category | Buffalo Bills | Atlanta Falcons |
|---|---|---|
| Offensive Trend | Declining consistency | Rising dominance |
| QB Performance Trend | High-risk, high-reward | Stable and improving |
| Run Game Trend | Moderately efficient | Elite |
| Defensive Trend | Bend-but-break | Aggressive and disruptive |
| Turnover Trend | Increasing | Low-risk football |
| Momentum Impact | Negative | Major confidence boost |
FAQs
1. Who had the most impressive performance in the Bills vs Falcons matchup?
Bijan Robinson delivered the standout performance with 238 total yards and an 81-yard rushing touchdown that shifted the game’s momentum.
2. How did turnovers affect the final outcome?
Buffalo’s two interceptions stalled drives and gave Atlanta short fields, while the Falcons protected the ball perfectly.
3. Which defensive players made the biggest impact?
DeAngelo Malone, Dee Alford, David Onyemata, and Ed Oliver contributed the most impactful defensive plays.
4. How did the quarterbacks compare in efficiency?
Michael Penix Jr. played turnover-free football with 250 yards, while Josh Allen threw two interceptions under heavy pressure.
5. What do the match stats say about both teams’ strengths and weaknesses?
Atlanta showed balance and efficiency, while Buffalo struggled with protection, turnovers, and drive sustainability.